Geoloc package
Geoloc is a python package that identifies the places mentioned in a given text.
The possible practical applications of this package are the following: imagine you work for a certain news agency, like TV3, and you would like to know how this agency treats the different areas in which it is emitted. Our program could help you do that with just a mouse-click. Now imagine that you are a middle school Geography teacher. You could use our interactive program to foster your students’ interest in this discpline. There are many other applications we can think of, but we believe that, if you read this description and you get to know how the program works, you yourself will come up with several ones.
How does the script geolocalize?

This software uses the wikipedia API (Application Programming Interface) in a first stage. Each time it comes across a new word (or a compound expression) that begins with a capital letter, our program connects with Wikipedia and checks if the word page has coordinates. If it doesn’t, or if there is no article for this word, the word is saved in our dictionary with a 0. On the other hand, if the Wikipedia API positively responds to our coordinate request, we store both the coordinates and the word.
Therefore, if we happen to encounter again one of these words, we will not need to ask Wikipedia again and our program will run much faster.
Why Wikipedia instead of other geolocation services (Open maps, Google maps, Geonames…)?
One of the first challenges when developing the aforementioned script was to chose a good source of information. First, we thought of loading a static database like The Cartography Catalan Service. However, it has only town and city names, which is not enough for our purposes. On the other hand, other sources of information, like Geonames and Google maps, are fetched with too much un-hierarchized information.
The local Wikipedia, in our case the catalan version, provides us with the necessary positive bias needed to accomplish our task, as it gives more weight to those entities that are more relevant to the local targeted community.
One of the other advantadges of using Wikipedia is that our program can run on any language. However, it is optimized to run in Catalan, as the structure of compound expressions depends from language to language and we deliveretely designed it to excel in Catalan. With minor changes, we have also prepared the program for dealing with Spanish, English, French and German, and it does perform incredibly well on these. You will find some examples in different languages in the repository (https://github.com/GEOLOC/geoloc). As an example, when we analyze elpais_es_grecia.txt we obtain Berlín, París, Roma, Madrid and BCE. In bbc_en_greece.txt we find Greece, Brussels, Athens, IMF and France.
How do we identify compound nouns?
Another difficulty we had to face when developping the script was that compound names are relatively common in romance languages. Expressions like “Santa Maria del Mar” or “Sagrada Família” would never be geolocated if we only analyzed those words that start with a capital letter. Without going into further detail, let us just say that we modified the script so that it knew how to deal with these expressions.
In fact, once these modifications were made, as it is common in Computer Science, we encountered problems that arose from these same changes: there is no page in Wikipedia entitled “Jocs d’Hivern de Sotxi” (Sochi Winter Games) and therefore, our program wouldn’t be aware that this sentence makes clear reference to “Sotxi”, a well-known Russian city. However, the program now works well and can correctly analyze any compound expression.
With these changes, if we run our program on the news emitted by TV3 throughout the year 2014, it turns out that we can geolocate more than 90% of such news.
Results
First, let us graphically ilustrate how TV3 treats the different locations it mentioned throughout the year 2014.
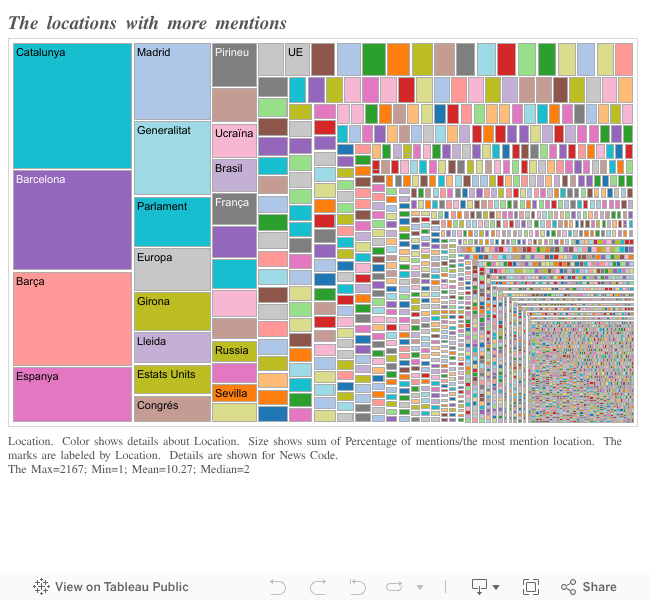
We can see that Catalunya is the most mentioned entity, followed by Barcelona.
Maps
Now let us present some maps to visualize other interesting things that we found. We created them using CartoDB, which is free and very easy to use.
The first map we created was a dynamic visualization of the covered locations by TV3 on a daily-basis. In fact, this is a pretty boring map because, to a great extent, the same regions keep popping up day after day. However, this is actually the purpose of the map: to let people see how repetitive news really are.

The second map is of a similar nature: it shows the 4-day-aggregated covered locations by TV3, so it is better than the previous one for getting a glimpse of what TV3 talks about. But it serves a better purpose: as this visualization has been made with real news, we can try to remember some of the major events that took place in 2014 and check if they are indeed represented in the map. I am sure the reader remembers the terrible Ebola outbreak that took hold in West Africa, which caught for the first time the international press agency’s attention on August 2014. This change in coverage can be perfectly seen in our map. At the same time, let us remember that a Malaysia Airlines flight disappeared with 227 people on board on 8 March 2014; an event also represented in our map. At this stage, we invite the reader to think of a major event occured in 2014 and check if it does show up in the aforementioned visualisation.

Last but not least, let us present an interactive map of all the different locations covered by TV3 throughout the year. If you click on one of the little orange spots, you will be able to see the name of the entity it represents and a list of numbers. These correspond to the news ids that mentioned this place.

If you type in the top right box “Barcelona”, you will see that there are lots of different geolocated entities within Barcelona. As we explained before, our program recognizes compound expressions and therefore, things like “Universitat de Barcelona”, “Ajuntament de Barcelona” and “Hospital Clínic de Barcelona” are assigned different coordinates, resulting in a very rich and complete map.
The interactive figures are published in this link: http://geolocnews.tumblr.com
Authors (alphabetical order)
Roderic Guigó Corominas, Jorge L. Salcedo Maldonado, Adrià San José Plana, Manel Vila Vidal, Josep Zapata García